How to read radar cells and municipality ETAs on the map
The map's nowcasting layer analyses recent observed radar frames to detect intense precipitation cells and, only when tracking passes reliability checks, displays estimated motion and indicative municipality ETAs. It is not an official warning or a guarantee of rainfall. Every diagram uses fictional cells, places and times, not current weather information.
Open radar cells and municipality ETAs on the mapAlways check the source timestamp: radar and weather-station data are observations, while ICON-2I provides forecasts. Experimental nowcasting does not replace official weather warnings.
Enable Radar cells / municipality ETA and return to NOW
Open Layers with ≡, find the Analyse group and enable Radar cells / municipality ETA. Press NOW on the timeline first: public live nowcasting is calculated from the most recently available observed radar frame, not from future ICON-2I forecast images.
The nowcasting card reports the number of detected cells and, when available, the count of cells with sufficiently reliable tracked motion. A detected cell may appear without speed, direction or ETA, and not every coloured radar echo qualifies as a detected cell.
Selecting a past observation or an ICON-2I forecast pauses live nowcasting. The historical verification laboratory is a development-only tool and not a public live feature; return to NOW instead of treating past or forecast images as current nowcast output.
Try it on the map, step by step
- Open the map and press NOW to select the latest available observed radar frame.
- Enable Radar cells / municipality ETA in the Analyse group.
- Read the nowcast summary for detected cells, available tracks or a statement that no reliable data are available.
What is a radar cell? Reflectivity threshold and observed outline
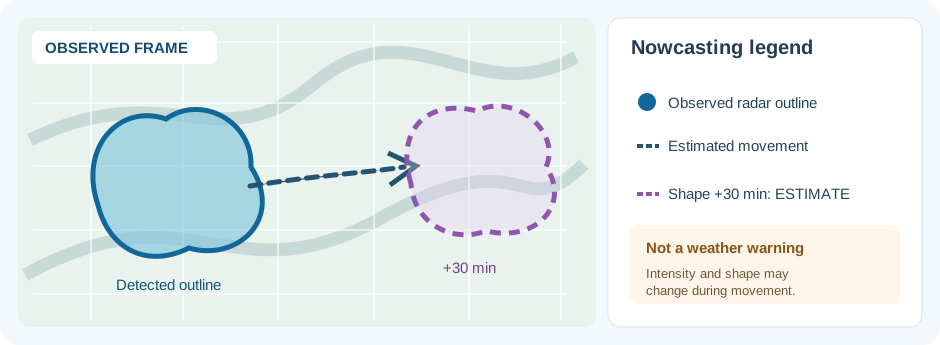
The detector groups radar pixels with reflectivity above its configured threshold and a sufficiently large footprint. Its observed outline describes the area meeting these criteria, not all the precipitation nearby: weaker rainfall may extend beyond that boundary.
Reflectivity is expressed in dBZ and indicates radar echo strength, not millimetres of rain collected at a ground location. The threshold shown in the card is a detector setting and may change with later configuration, so read its actual displayed value.
If a raster outline is missing, the map can instead draw a dashed circle that approximates the equivalent cell area. That circle is not a directly observed boundary; the summary or popup identifies the approximation so it is not mistaken for exact geometry.
Try it on the map, step by step
- Enable the layer and locate a cell with an outline, if one is available.
- Open the cell popup and inspect reflectivity in dBZ, area and the outline explanation.
- If it uses a dashed circle instead, treat the circle as an approximation rather than the precise edge of observed rainfall.
The cell popup: intensity, speed, direction and tracking quality
Select a radar-cell marker to open its information popup. When available, it shows the cell identifier, maximum and mean reflectivity, area, intensity, trend and tracking information. Estimated speed and direction appear only when the cell has a motion track deemed usable.
Cell movement speed in km/h estimates the displacement of radar echoes, not wind speed measured by an ARPA weather station. The motion arrow likewise describes an estimated radar-cell track, not the wind direction at one street.
Tracking confidence describes geometric consistency between observations. It is not the probability that rainfall will reach a municipality: even with coherent tracking, a cell can change shape, split, weaken or turn.
Try it on the map, step by step
- Open a cell popup and identify its cell ID, if any are detected.
- Read maximum and mean reflectivity in dBZ and cell area in km² without converting them directly to rainfall totals.
- Check whether speed, direction, tracking and confidence are available before interpreting any municipality ETAs.
Estimated movement and the projected +30-minute outline
When the system associates consecutive observations with sufficiently reliable motion, it can draw a movement line and translate the observed outline to an estimated position at +30 minutes. This is a geometric shift, not a physical forecast of storm growth, weakening or decay.
In the diagram a solid shape marks the observed cell, while the dashed shape shows where the same area would be if its estimated movement continued. The future shape cannot account for additional rainfall, changes in outline or alterations in atmospheric flow.
If recent tracking is inadequate, the page does not fabricate a motion line, speed or future footprint. A coloured radar echo on its own does not warrant a precise arrival-time claim.
Try it on the map, step by step
- Open a cell showing an estimated track, where available.
- Distinguish the solid observed outline from the motion line and the dashed projected outline.
- Use Locate radar cells if the summary indicates detected cells outside your current map view.
Municipality ETA: what does a possible impact window mean?
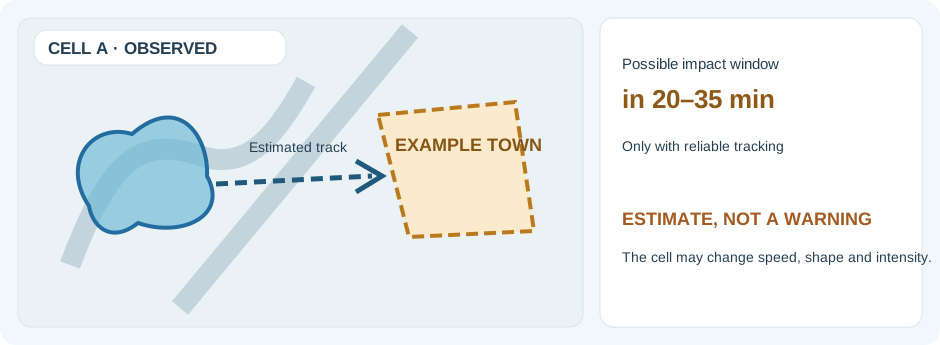
A municipality ETA is an indicative time window based on geometric overlap between a projected radar cell and the municipality's area. It describes potential short-term impact, not a guaranteed time when rain will begin on every street or at every address.
The layer may display a range, such as 20–35 min, or possible impact ongoing when a cell already geometrically intersects a municipality. The location name refers to an administrative area rather than every point within it; storm shape, speed and location may change.
The illustration shows a fictional radar cell A with an invented 20–35 minute possible impact window for an example town. This does not describe live weather, confirm that a storm will intensify or prove that rainfall will reach every part of the town.
Try it on the map, step by step
- Press NOW and enable nowcasting; open a cell popup with published ETAs, if available.
- Read the municipality name and time window against the observed radar frame's timestamp.
- Treat ETA as an experimental geometric estimate and consult official warning sources for weather-related safety decisions.
Why the map can show no cells or no reliable track
Radar can display broad weak rainfall without any pixel group meeting the detector's intensity and minimum-area thresholds. In other cases a cell is detected but consecutive scans do not support reliable motion. An absent ETA is not proof that no thunderstorm or rainfall is present.
Delayed radar updates, limited coverage, mountain blockage and rapid changes in storm shape can all complicate matching a radar cell between scans. The summary differentiates the count of detected cells from those with a usable motion track and reports when data are unavailable.
This layer is intended for relatively intense echoes, not every patch of weak precipitation or every local hazard. Use the standard radar overlay to examine broader rainfall and compare nearby ARPA observations where available.
Try it on the map, step by step
- Enable nowcasting at NOW and read the actual count of detected cells.
- If there is no ETA, check whether cells were detected without a reliable trajectory.
- Switch off nowcasting and inspect the observed radar frames; seeing rainfall does not depend on any ETA being published.
Nowcasting, ICON-2I and official warnings answer different questions
Nowcasting projects recent observed radar-cell motion into the short term; ICON-2I predicts future hourly precipitation using a numerical model; official weather warnings come from competent authorities. Neither a geometric ETA nor a model frame automatically constitutes an official warning.
Moving the slider to a historical scan or a future model frame pauses public live nowcasting. Return to NOW for estimates tied to recent radar observations, and do not mentally superimpose an earlier cell track on a different frame's precipitation image.
An ETA is not a substitute for official civil-protection advice or a reliable single basis for deciding whether to enter a hazardous area. Both observations and forecasts can be delayed or revised.
Try it on the map, step by step
- With nowcasting active, read the latest radar timestamp and note that ETAs are estimates.
- Move the timeline into ICON-2I FORECAST and observe live nowcasting pause.
- Press NOW to return to recent analysis; consult official weather warnings whenever safety is involved.
Complete walkthrough: inspecting a radar cell near your destination
Suppose you want to know whether an intense radar cell has been detected near your town and whether an indicative municipality impact window is available. Follow the sequence: radar frame and time first, then the cell's observed shape and tracking quality, then any published ETA.
A cell can have an observed outline but no reliable motion track, in which case the walkthrough ends without assigning speed or ETA. Even with a track, the cell is not guaranteed to maintain its shape or intensity.
For rainfall already measured on the ground, enable the ARPA Rain layer on a suitable observed time window. Municipality ETA and hourly gauge totals answer different questions and must be checked against their respective timestamps.
Try it on the map, step by step
- Open the map at NOW and check the actual time of the latest observed radar frame.
- Enable Radar cells / municipality ETA and open a cell near your location if one is present.
- Inspect tracking and direction before reading any ETA as an indicative window; switch to ARPA Rain for available measured ground rainfall.