How to read ARPA weather stations on the Lombardy map
Weather stations report observations at individual sensor locations, not the average temperature or rainfall for an entire city. Follow this guide to choose a metric, inspect station popups and compare hourly ground rainfall with radar echoes. Every number in the illustrations is fictional and intended only to explain how to interpret the interface.
Open ARPA temperature readings on the mapAlways check the source timestamp: radar and weather-station data are observations, while ICON-2I provides forecasts. Experimental nowcasting does not replace official weather warnings.
Enable weather stations from the Layers panel
Open the main map and press ≡ to display Layers. Under Observe, select Weather stations and then Temperature, Rain, Humidity or Wind. Pressing any one of the four metric buttons also enables the weather-station layer if it was previously off.
The observed radar and ARPA stations are distinct layers that can be shown together. Numeric map markers belong to individual ground sensors, while the radar's coloured areas represent precipitation echoes detected in the atmosphere.
Selecting a different metric changes the marker numbers and can change how many stations have usable values. Not every station measures every variable. Zooming can help separate nearby markers but cannot improve the resolution of the underlying measurements.
Try it on the map, step by step
- Open Temperature using the link below this section.
- Show Layers with ≡ and press Humidity; check how marker readings change.
- Choose Wind and open a popup for a station with an available measurement.
The station popup: location, elevation, timestamp and units
Select a marker to open the individual station's popup. Its name identifies the sensor location, not the whole surrounding town. Check the measurement time and the station's elevation, where available, before comparing different sensors.
The page displays temperature in °C, relative humidity in %, wind speed in m/s and hourly rainfall in mm. A station popup may also report gusts or wind direction when the provider supplies those fields, but not every station or metric has complete coverage.
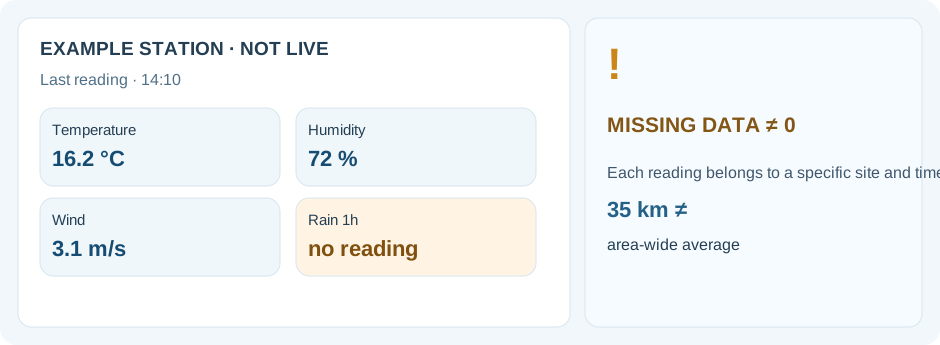
In the illustrative example one station reports 16.2 °C, 72% humidity and 3.1 m/s wind, while its hourly rainfall value is missing. The missing field does not mean rainfall was zero: no usable reading is available for that field.
Try it on the map, step by step
- Open a station marker and read its name and observation time.
- Check whether each value is available and note any individual measurement timestamps.
- Compare two stations while keeping their locations, elevations and timestamps in mind.
Temperature in °C: a local reading, not a city-wide average
Choose Temperature to display degrees Celsius reported by the available station sensors. You can keep the radar layer enabled to see observed precipitation at the same location, but ground temperature comes from a station and cannot be inferred from radar colours.
Temperatures may differ between a town centre, rural land, a valley floor and higher terrain. If two nearby markers show different readings, inspect the sites, their elevation and the observation time before interpreting the difference as a weather change over time.
A station with no current temperature may show a dot or an unavailable-reading indication. Do not borrow a distant station's value or treat the displayed number as a forecast for future temperatures.
Try it on the map, step by step
- Enable Temperature and zoom towards the area you are interested in.
- Open two nearby station popups to compare location, elevation and timestamp.
- For predicted future precipitation, use the ICON-2I timeline, which does not provide a forecast of local temperature.
Humidity, wind speed, gusts and direction
Select Humidity to display relative humidity as a percentage; select Wind to see wind speeds in metres per second at reporting stations. These are ground observations, not model-derived wind forecasts or a direct indication of radar-cell movement.
High relative humidity alone does not tell you whether rain is falling or is about to begin. Wind measured in an open field can differ considerably from wind between buildings or in a nearby valley.
Some popups include a wind gust or direction in addition to current speed. Read the unit and sensor timestamp: a missing gust or direction should not be treated as evidence of calm conditions.
Try it on the map, step by step
- Choose Humidity and inspect a station with a percentage reading.
- Switch to Wind and see whether the popup includes gust and direction.
- Compare that station's location with the radar echoes without treating ground wind as a storm-track forecast.
ARPA Rain: measured hourly accumulation and the display threshold
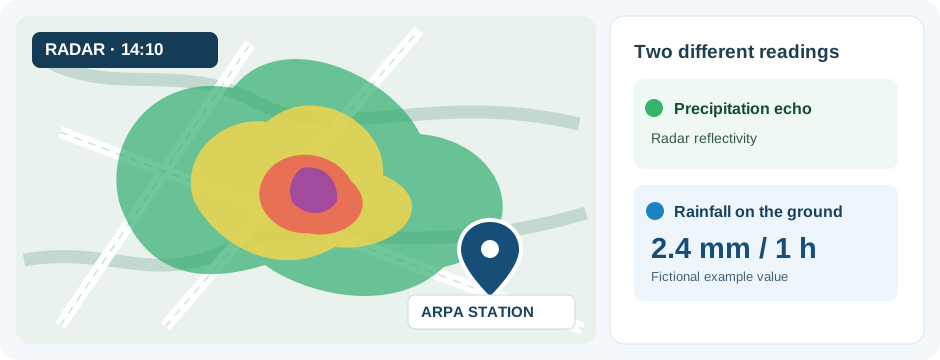
The Rain metric reconstructs measured hourly rainfall from available ARPA rain-gauge samples for the selected observed radar time window. The marker's millimetres are a ground measurement, not radar reflectivity, and the rain markers are shown for amounts of at least 0.1 mm in the selected hour.
The application selects compatible samples within a limited time tolerance. If no samples are close enough to the requested hour, the panel may say the data are unavailable. An absent marker does not prove that the nearby ground was dry.
The illustration shows radar echoes extending beyond a single rain gauge reporting 2.4 mm in an hour. You cannot assign the gauge's point measurement to every place under the radar echo or convert the radar colour directly to the gauge's number.
Try it on the map, step by step
- Press NOW, enable Rain and read the time-window status message.
- Open a rainfall marker if one is available and check the actual observation time.
- Move the timeline to a different observed hour and see whether the marker values, count and valid window change.
Why a station's timestamp can differ from the radar frame
Weather radar and ARPA station observations are not necessarily measured or published at exactly the same time. The timeline reports the selected radar scan time, while each station popup and status message reports the actual measurement times available for that sensor.
For hourly rain on an observed frame, the station layer searches for compatible samples in that one-hour window; it does not fabricate totals when they are too far from the selected time. Temperature, humidity and wind display the latest available station readings rather than a historical snapshot synchronised to each timeline minute.
Moving into an ICON-2I future forecast hides observed station values in the forecast view: a future hour cannot yet have observed rainfall. If ARPA updates are delayed, an older reading may remain visible; always check its timestamp.
Try it on the map, step by step
- Read the radar card's timestamp and the station popup's timestamp separately.
- Move the timeline to an earlier observed frame and check ARPA Rain availability for that hour.
- Select a forecast frame and verify the interface does not display future station data as if they were observations.
City pages: what does the 35 km station radius mean?
On the twelve provincial-capital radar pages, available ARPA station markers are filtered to within 35 km of the chosen city's centre. This is not a network limited to that municipality, and the page does not compute a representative average across all its neighbourhoods.
A sensor can be in a neighbouring province, at a different elevation or near a lake. Check its location, elevation and timestamp before using it to interpret conditions around your destination. The regional homepage allows you to explore station markers over a wider area.
If a city has no suitable reading for a selected metric, the site does not assign a measurement from a different city. The observed rain radar stays usable even when a nearby point measurement is unavailable.
Try it on the map, step by step
- Open a city radar page from the regional homepage.
- Choose Temperature and check where its station markers are actually located.
- Switch to Rain, then return to the regional radar to compare the wider rain-echo pattern with the point measurements.
Missing data, publication delays and the meaning of an empty layer
An ARPA dataset can arrive late or lack certain metrics at individual stations. A temporarily empty layer or a missing reading is not a measured value of zero, a radar failure or proof of no rainfall anywhere in the displayed region.
If a marker is missing, review the selected metric, map coverage and, for hourly rain, the time chosen on the radar timeline. Sensor availability and publishing schedules vary across locations and parameters.
For travel, outdoor plans and weather safety, consult official weather bulletins and civil-protection warnings as well. Point measurements on this map do not replace complete forecasts or official alerts.
Try it on the map, step by step
- Check which station metric is active and read its time-status message.
- Inspect whether a value is marked unavailable instead of assuming an empty point means zero.
- For the difference between radar echoes and ground measurements, read the separate How to read the radar guide.