How to read ICON-2I rainfall forecasts on the Lombardy map
Observed radar and forecasts are different products even though they share the same map. Where available, the future timeline shows ICON-2I hourly predicted precipitation up to 72 hours ahead, while the frames before NOW are actually observed radar scans. This guide shows how to read forecast hours, colours and validity periods using diagrams with fictional numbers, not current weather data.
Open the first available ICON-2I forecast frameAlways check the source timestamp: radar and weather-station data are observations, while ICON-2I provides forecasts. Experimental nowcasting does not replace official weather warnings.
Start by separating OBSERVED radar from FORECAST rainfall
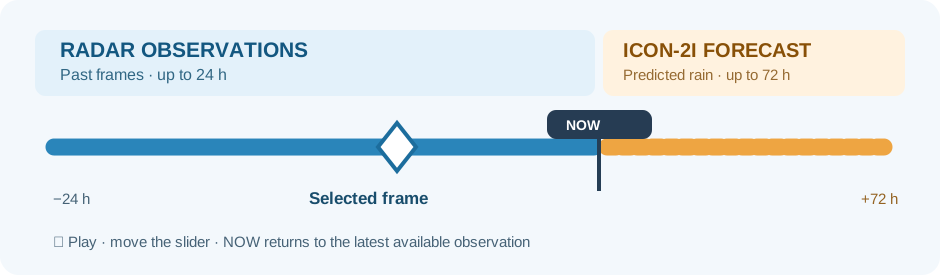
Below the map the timeline shows OBSERVED frames before the NOW marker and ICON-2I FORECAST frames after it. Radar detects precipitation echoes in the atmosphere; ICON-2I calculates rainfall expected during future hours according to a weather model.
Moving the slider beyond NOW is not a continuation of radar scans into the future. The source and physical quantity change, and the map's information card identifies the currently selected frame as either an observation or a forecast.
A forecast frame represents a modelled scenario valid for a given hour: it is not a ground measurement or proof of rainfall at one precise point. Predictions at longer lead times may differ from conditions eventually observed.
Try it on the map, step by step
- Open the map and press NOW to see the latest available observed scan.
- Move the slider right into ICON-2I FORECAST, if model data are available.
- Compare the information-card labels in the two timeline sections before interpreting map colours.
Open the next available forecast and browse its valid times
Use the Rainfall forecast shortcut on the homepage, the map link below or the slider's future section. Once forecast metadata have loaded, the page selects the first available ICON-2I forecast frame when you open that shortcut.
Press ▶ to play through available frames, or move the time slider to inspect a particular hour and pause whenever you need. Actual forecast coverage and the number of available hours depend on the provider data for the current model run.
NOW returns to the latest available observed radar scan, not to the forecast model's initial time or the exact minute on your own clock. Observed radar remains usable even when the forecast model is unavailable.
Try it on the map, step by step
- Open the forecast layer and wait for the first available future frame.
- Check its valid time, then move the slider to another available forecast hour.
- Press NOW to return to the latest observed radar frame without confusing the two products.
Forecast valid time, model run time and hourly rainfall
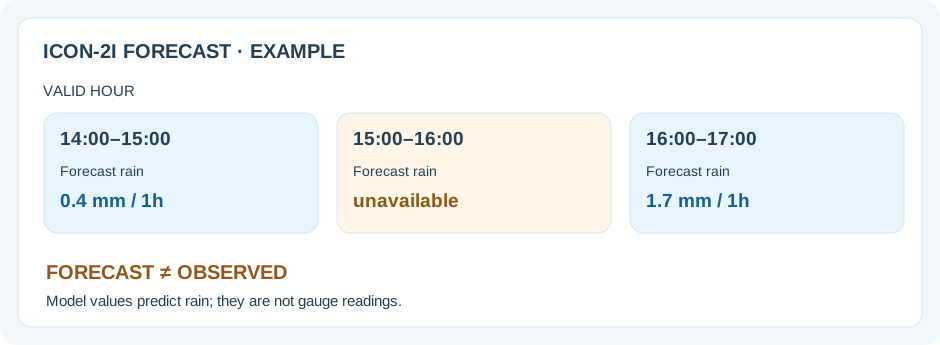
Each future frame has a valid time: its colours represent rainfall predicted for the corresponding hourly interval, not necessarily a weather event occurring at the precise minute displayed. The site may also show the forecast model's run time, which is different from the forecast valid time.
For example, predicted rainfall labelled for 14:00–15:00 belongs to that one-hour interval; it does not mean that all of it must fall at exactly 15:00. A newer model run can change rainfall intensity, timing and geographic position for the same forecast valid time.
Do not confuse the time at which the website retrieved the model data with the time for which the forecast is valid: model run time, valid time and current time are separate timestamps.
Try it on the map, step by step
- Select a future frame and read its forecast valid time.
- If displayed, inspect the ICON-2I run timestamp alongside the source label.
- Advance one forecast hour and compare the next modelled rainfall pattern without treating it as an observed scan.
Forecast colours and millimetres are not radar reflectivity
The observed radar and ICON-2I forecast layers use visually similar colour scales to help locate precipitation, but they depict different quantities. Radar reflects an indirect observation of precipitation echoes; ICON-2I forecasts hourly precipitation calculated from model fields.
Yellow or red forecast pixels indicate relatively stronger modelled precipitation on the map's scale, not rain already measured by a gauge at that location. Do not convert a colour to an observed millimetre total for a particular street or garden.
The model represents a gridded weather field: zooming in does not create a separate, highly precise forecast for each building. To inspect actual ground rainfall, return to observed frames and check nearby ARPA rain gauges with their own timestamps.
Try it on the map, step by step
- Select a future frame and find a coloured patch near the area of interest.
- Press NOW to inspect the separately observed radar echoes and their actual timestamp.
- Enable ARPA Rain on an observed frame if you need available ground-level hourly rainfall measurements.
Using Play without losing the past/future boundary
Playback lets you see how precipitation areas change across available frames. In the observed portion of the timeline you can follow detected echo movement; in the future portion you see ICON-2I predicted changes, not radar motion already confirmed by observations.
Pause near NOW and check the selected-frame label before interpreting an approaching coloured band. Playback can contain both kinds of frames in one sequence, but you still need to check which timeline phase is selected.
If one image fails to load, the map may keep the previous complete raster while the slider remains on the requested time and reports that the new frame is unavailable. The retained image is not the missing hour's forecast.
Try it on the map, step by step
- Start playback at an observed radar frame from roughly two hours earlier.
- Pause just before NOW and note the position of observed precipitation echoes.
- Continue into the forecast section and read it as a modelled scenario rather than confirmed future movement.
Why observed rain gauges are hidden on future frames
ARPA rain gauges provide ground observations, and the Rain metric reconstructs accumulation for the selected observed radar hour. Future forecast hours cannot yet have ground measurements, so the map hides observed station values while you view ICON-2I future precipitation.
This prevents a gauge measurement from 14:00 from looking like a reading already taken at 17:00. To compare radar and rain gauges, return to an observed frame and check the timestamp of the individual station.
ARPA temperature, humidity and wind are also observations with their own timestamps. They are not predictions of future temperature, humidity or wind supplied by this ICON-2I precipitation timeline.
Try it on the map, step by step
- Select an observed radar frame, enable ARPA Rain and read the gauge time-window label.
- Move into the future and check the station panel's explanation for hiding observed measurements.
- Return to NOW and compare the observation timestamps before using the figures together.
What to do when a forecast run or frame is unavailable
A provider can publish a model run later than expected, a forecast image may fail to load or some future intervals may be unavailable. The map reports this rather than treating unavailable data as a forecast of dry weather or zero rainfall.
Observed radar remains accessible when ICON-2I data are missing. If the map keeps its last complete raster to avoid a blank image, read the timeline status: the requested time and the raster currently displayed may not match.
A newer model run may revise predictions. Recheck the actual available forecasts when conditions are changing and use official meteorological and civil-protection warnings when weather safety is involved.
Try it on the map, step by step
- Open ICON-2I and read any notice about an unavailable future frame.
- Press NOW to confirm the observed radar is still accessible.
- Never infer that a missing future image means there will be no rain or that the previous raster belongs to the selected hour.
Walkthrough: forecast rain during the next few hours near a town
Suppose you want to compare the latest observed precipitation near a town with the modelled rainfall in the next three hours. The useful information is the sequence of properly timestamped frames, not a single colour assumed to apply to the entire town.
The diagram values are invented and not a weather bulletin for any city. Forecast rain location, timing and intensity can change after the next model run, and an individual pixel does not determine precisely what will happen on one street.
The separate experimental nowcasting layer can estimate short-term geometric movement of recent intense observed radar cells. That is a different analysis and does not make a future ICON-2I forecast frame a confirmed observation.
Try it on the map, step by step
- Press NOW, locate your town and note the actual timestamp of the latest observed radar scan.
- Move one or two hours into the forecast and check the ICON-2I label and valid time.
- Inspect subsequent predicted hours separately, then return to observed radar and use the Nowcasting guide only to interpret experimental tracked cell estimates.