How to read Lombardy rain radar: a complete guide to the map
The interactive map combines several kinds of information: observed radar echoes, predicted precipitation, individual weather-station measurements, analysed radar cells and selected road traffic data. This illustrated guide shows where to find each control, how to check timestamps and how to avoid confusing measurements, forecasts and estimates. The diagrams use made-up example values: they are not current weather observations.
Open the interactive rain radarAlways check the source timestamp: radar and weather-station data are observations, while ICON-2I provides forecasts. Experimental nowcasting does not replace official weather warnings.
Get started: map controls and the Layers panel
Open the main map: the observed rain radar is enabled by default. Drag the map to move around, and use the mouse wheel, touch gestures or zoom controls to examine a location. Increasing the map zoom does not increase the resolution of the underlying meteorological measurements.
At the top of the map, ⛶ expands it to full screen and ⤢ restores the normal page. The ◎ button returns to the initial regional view without changing the selected time. Use ≡ to show or hide the Layers panel; full screen can be particularly useful on a phone.
The panel has four groups: Observe (radar and ARPA stations), Analyse (radar cells and municipality ETAs), Impact (Traffic) and Atmosphere (infrared satellite). Several layers can be enabled together. The upper-left card displays the selected radar mode and time; separate nowcast and traffic cards appear when those layers are enabled.
OpenStreetMap supplies the geographic basemap. Roads, towns and lakes help you locate the weather layers but are not weather readings. A place outside a product's geographic coverage may have no overlay even when it is raining.
Try it on the map, step by step
- Open the map and read the latest available observation time in the live radar card.
- Press ≡ to open Layers; keep Rain radar selected.
- Move the map towards your location, then press ◎ to return to the regional view.
What radar echoes and colours actually mean
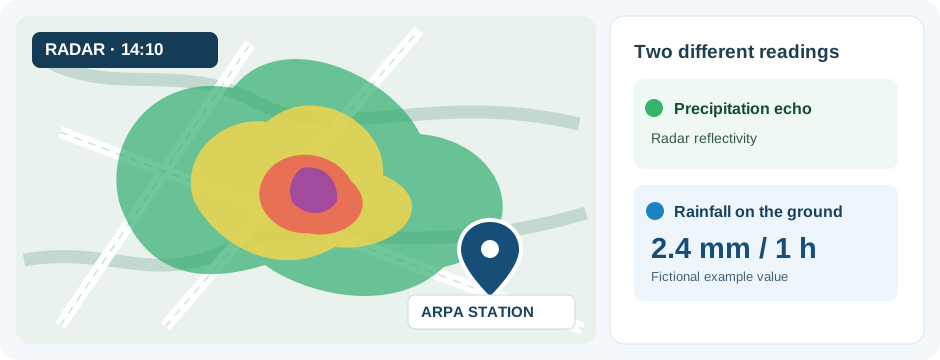
The coloured areas represent the intensity of precipitation echoes detected by weather radar. On the colour scale displayed here, green generally represents weaker echoes, followed by yellow, red and purple for increasingly strong echoes. A radar colour is not a rain gauge and cannot be read directly as the millimetres of rain measured on the ground at every point.
An echo can arise from rain, snow or other particles aloft. Mountain blockage, non-weather echoes and differences between the radar beam's altitude and the surface may affect the display. An area without a visible echo is not a guarantee of dry ground, particularly in mountainous areas or outside coverage.
Do not treat an observed radar colour and an ICON-2I forecast colour as interchangeable measurements. The two map layers use a similar visual scale, but the observed radar depicts reflectivity and ICON-2I depicts modelled hourly rainfall.
Illustrative example: a yellow area over a district shows a stronger radar echo than an adjacent green area. An ARPA rain gauge might report 2.4 mm in one hour at its precise location. You cannot derive that 2.4 mm from the yellow echo or apply it to the entire coloured region.
Try it on the map, step by step
- Select an OBSERVED radar frame and find the coloured area nearest the place you are checking.
- Compare consecutive observed frames to see where the echo moves without interpreting the colour as measured rainfall.
- Enable Weather stations, then Rain, to check whether an actual rain gauge has an observation for a relevant time window.
The LIVE OBSERVATION card: how recent is the map?
The top-left card differentiates the latest available observation from a past radar frame or a future model forecast. LIVE describes the mode displaying the most recently available observations, not a claim that weather radar updates continuously without any delay.
Check the frame timestamp and the displayed age of the data. Your current clock time and the radar product's timestamp may differ because scanning, publication, transfer and processing all take time.
If you move the timeline to an earlier scan, you are viewing past conditions. If a frame is missing or a source is unavailable, the website may retain the last complete frame and report the failure; do not assume the retained image depicts the current minute.
Using the timeline: Play, time slider and NOW
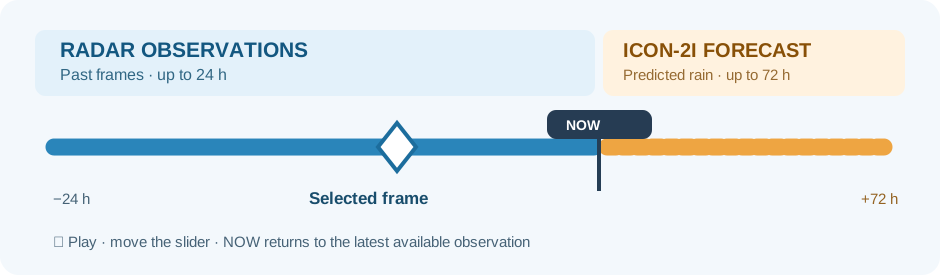
The timeline below the map lets you move through time. The OBSERVED section contains radar frames from approximately the preceding 24 hours; NOW separates observations from ICON-2I FORECAST frames, which can extend up to 72 hours ahead when the necessary model data are available.
Press ▶ to play the frames and pause to stop playback. Drag the slider manually to inspect a specific time. The selected frame's displayed date and time are more informative than the slider position alone.
NOW returns you to the latest available radar observation rather than the exact minute of your own clock. Crossing the observed/forecast divider changes the source and meaning of the displayed information: forecasts are not observations continuing into the future.
Example: play two hours of past frames to watch a band of echoes approach a town. Stop and select a future frame: if the model is available, you are now seeing ICON-2I predicted rain, not an observed movement of the storm.
Try it on the map, step by step
- Press NOW and read the timestamp of the latest complete radar frame.
- Drag the slider left, then press ▶ to follow the movement of past observed echoes.
- Pause and move the slider into the forecast section; check that the information card explicitly identifies the frame as a FORECAST.
ICON-2I rainfall forecast: what the future frames represent
In the future part of the timeline, the map displays ICON-2I predicted precipitation for the indicated hourly interval, when model data are available. These frames are neither radar scans nor complete forecasts of temperature, wind, sunshine or every individual street.
Check the forecast valid time and, where shown, the model run time. The hourly rainfall forecast comes from model fields and may change with a newer run. A coloured pixel is not a ground measurement and does not guarantee that a thunderstorm will occur at that exact point.
If a forecast frame is missing, the map reports its unavailability and may retain the last complete frame. Missing model data must not be read as a forecast of zero rainfall.
The separate English destination weather pages for Lake Como and Lake Garda use a different model and sample specific towns. Their general weather forecasts are not the same product as this ICON-2I precipitation-only map.
Try it on the map, step by step
- Use Open this layer below to select the first available forecast frame.
- Check the forecast valid time; compare it with past observations without treating it as already measured rain.
- Scroll through future hours to follow the predicted development, bearing in mind that later model updates may alter it.
ARPA weather stations: temperature, rain, humidity and wind
Switch on Weather stations in Layers and select Temperature, Rain, Humidity or Wind. Pressing a metric button also enables the station layer automatically if it was turned off.
Station markers show readings from individual sensor locations. Open a marker to inspect the site name, available elevation, timestamps and other published measurements, including temperature in °C, rainfall in mm, relative humidity in %, wind speed in m/s and any additional popup details.
Not every station measures every variable. An unavailable reading is not zero. ARPA and radar data are published on different schedules, so always compare the timestamp of each measurement rather than treating them as simultaneous.
The regional view displays available stations across the map. On provincial-capital pages, markers are filtered to a 35 km radius around the city centre. A nearby station is neither a city-wide average nor necessarily located within the same province or at the same elevation.
Try it on the map, step by step
- Open the map with the Temperature layer and select a marker near your destination.
- Check the individual sensor timestamp and location rather than applying its number to the whole city.
- Switch to Humidity or Wind and notice that the available readings and number of markers may change.
ARPA Rain: measured hourly accumulation and the selected time window
The Rain button in the ARPA station layer does not show radar colours. It displays hourly precipitation accumulated by available rain gauges for the observed time window associated with the selected radar frame. The application constructs the available totals from matching samples.
The map highlights stations with at least 0.1 mm in the selected hour, and its status message reports the relevant station count and latest measurement window. A missing marker does not prove there was no rain: samples, nearby sensors or a value above the display threshold may be missing.
A ground reading may have a different observation timestamp from the radar scan. Compare dates and one-hour windows, not just the minute shown on a single gauge.
When you select an ICON-2I forecast frame in the future, observed rain-gauge values are hidden. There cannot be an ARPA ground measurement for an hour that has not happened yet; the layer remains selected without fabricating observed totals.
Try it on the map, step by step
- Press NOW, enable ARPA Rain and inspect a rain-gauge marker if one is available.
- Move the timeline to another observed hour and check how markers, values and the time-window message change.
- Select a forecast frame: the station panel should explain that observed hourly rain is hidden during the forecast.
Radar cells and municipality ETA: interpreting experimental nowcasting
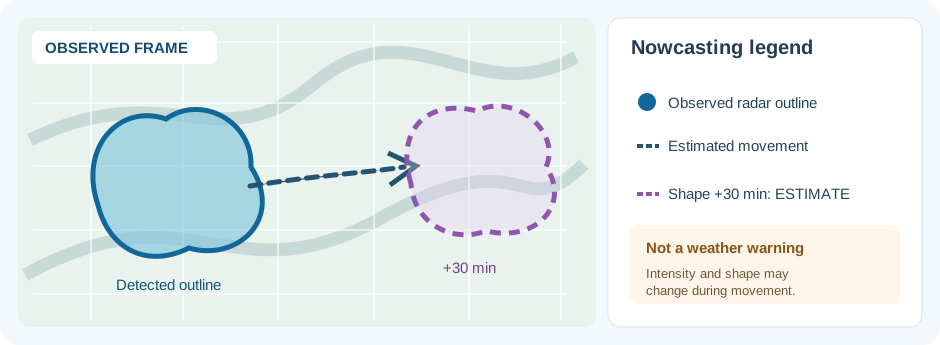
The Radar cells / municipality ETA layer analyses intense echoes in the latest observed frame and detects groups of radar pixels above a threshold. Where recent tracking is sufficiently reliable, it can show direction, speed and a geometrically translated shape at +30 minutes, along with indicative time windows for potential municipality impact.
A solid outline identifies the observed above-threshold radar area. The track shows estimated movement; a dashed +30-minute outline is the original shape moved geometrically, not a prediction of storm growth, decay or changing intensity. Where a raster footprint is missing, a dashed circle only approximates its area.
Select a radar cell to inspect available reflectivity, area, direction and reliable motion information, together with indicative ETAs where provided. The summary card can report how many cells were detected and how many were tracked. Use Locate radar cells to bring off-screen cells into view.
Public live nowcasting is calculated from the latest observed radar frame. Moving the timeline to a historical observation or an ICON-2I forecast pauses live nowcasting: return to NOW to inspect recent cells. ETA windows are not guaranteed rain onset times for every point in a municipality and are not official weather warnings.
Illustrative example: the observed outline of cell A appears alongside a dashed shape displaced by about 30 minutes. That projected shape indicates where the same outline would be if its estimated direction continued, not where a storm is certain to be in half an hour.
Try it on the map, step by step
- Press NOW and enable Radar cells / municipality ETA.
- Check whether reliable movement is available, then open a cell popup and read any indicative ETA.
- Move to another timeline time and note that live nowcasting pauses; return to the latest observation to re-enable it.
Traffic: monitored road sections, speed and proximity to radar echoes
Enable Traffic in the Impact group to display selected monitored road sections and any available incidents. The website retrieves traffic through its own server; if the provider is unavailable or not configured, the layer reports this explicitly instead of simulating traffic.
Markers and road lines cover only the selected monitored sections, not every road in Lombardy. Open a road popup to compare current speed, free-flow speed, estimated delay and the snapshot timestamp. The summary card reports available road sections, those with very slow traffic and incidents returned by the provider.
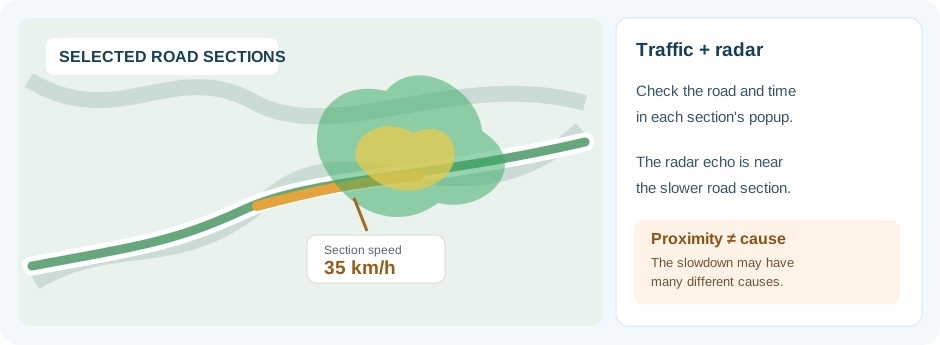
A spatial overlap with radar cells means geographic proximity only: it does not prove that rain caused a slowdown, road closure or incident. Radar and road snapshots may also differ in age, so compare both timestamps.
The provider is TomTom Traffic, credited beneath the map and in data popups. Provider calls are constrained by server-side caching and budgets. Road counts and available measurements may change between sessions.
Illustrative example: a monitored section shows 35 km/h compared with a free-flow speed of 80 km/h, with a radar echo nearby. The page can describe the slowdown and proximity, but it cannot infer the cause.
Try it on the map, step by step
- Enable Traffic and allow the Mobility summary to load.
- If road sections are available, open one and compare its speed and observation time with the radar card.
- Treat any spatial overlap as geographic context, not evidence that precipitation caused the delay.
Infrared satellite 10.8 μm: cloud information, not surface rainfall
The Satellite IR 10.8 μm layer is available under Atmosphere. Enable it to overlay infrared satellite imagery on the map. The satellite product does not provide measured rain-gauge accumulation and does not, on its own, identify everywhere it is raining.
The 10.8-micrometre infrared channel detects thermal radiation, so cloud properties, image time and the underlying surface all matter to interpretation. Visible cloud features do not necessarily imply rain, and weak surface rainfall may not appear in the same way.
You can enable both satellite and radar to compare nearby structures, provided you check the age of each source. Their overlap does not quantify rainfall or constitute a weather warning.
If the satellite product is unavailable, the rest of the map remains usable. A missing overlay does not mean there are no clouds.
Local city radar: reading the twelve Lombardy capital pages
The radar pages for Milan, Bergamo, Brescia, Como, Cremona, Lecco, Lodi, Mantua, Monza, Pavia, Sondrio and Varese reuse the same radar map, layers and timeline. They change the initial map centre and the relevant geographical description, not the underlying weather products.
On city pages, ARPA markers are limited to stations within 35 km of that city centre. A station may be located in another province, at a different elevation or lack the selected metric. Its measurement must not be presented as a city-wide average.
You can pan beyond the starting location; ◎ returns to the city view. Observed radar and ICON-2I precipitation forecasts have exactly the same meanings and limitations as in the regional view.
Disabled layers, missing readings and temporary errors
Lightning and Rivers are currently disabled in the public Layers panel: the lightning feed is still being checked, and the river layer is not yet available. Do not expect live lightning strikes or river-level readings when opening the map.
A missing radar frame, ICON-2I forecast hour, ARPA sensor reading or road measurement can reflect provider availability, publishing delays, geographic coverage or service configuration. The website can keep the previous complete frame and report that the requested one is unavailable.
Do not combine values published at different times as though they were a single simultaneous snapshot. For travel, outdoor plans and weather safety, also consult official meteorological and civil-protection warnings.
Full walkthrough: checking a rain cell approaching a city
Suppose you want to see whether observed precipitation is approaching a town and whether nearby rain gauges already report rainfall. You do not need all the layers on at once: start with the timestamps and add one type of information at a time.
Try it on the map, step by step
- Open radar and press NOW; note the timestamp of the actual latest available observation.
- Move back through two or three observed frames or press ▶ to see whether the coloured echo is shifting towards the town.
- Enable ARPA Rain and check a nearby reading from the selected hour. If no marker is shown, do not conclude that rainfall was zero.
- Return to NOW and, if available, enable Radar cells / municipality ETA. Interpret the projected motion and ETA as estimates, not guaranteed arrival times.
- If your planned road lies among the monitored sections, enable Traffic and compare its road status with the radar, without assigning a cause to every slowdown.
- Finally, move into ICON-2I FORECAST to examine modelled future rainfall separately from what the radar has already observed.
Data sources: what are you actually comparing?
OpenStreetMap provides the basemap; Radar-DPC provides radar and satellite products and underpins nowcast analysis; ARPA Lombardia supplies point measurements; ICON-2I from Agenzia ItaliaMeteo/ARPAE supplies future precipitation frames; TomTom Traffic supplies monitored road snapshots and Regione Lombardia supplies municipality references.
Radar means indirect observation of precipitation echoes aloft; a rain gauge reports accumulation measured at one ground location; ICON-2I predicts future hourly rain; nowcasting ETA is an indicative geometric projection; traffic reports selected road-section snapshots. These are not interchangeable quantities.
Source credits appear beneath the map. The website and the guide's fictional diagrams are informational tools, not substitutes for official weather warnings, on-site checks or authoritative road advisories.